Benchmarking lung integration#
Here we walkthrough applying the integration benchmarking metrics on the lung atlas example from the scIB paper.
import numpy as np
import scanpy as sc

from scib_metrics.benchmark import Benchmarker, BioConservation, BatchCorrection

%matplotlib inline
Load and preprocess data#
adata = sc.read(
    "data/lung_atlas.h5ad",
    backup_url="https://figshare.com/ndownloader/files/24539942",
)
adata
sc.pp.highly_variable_genes(adata, n_top_genes=2000, flavor="cell_ranger", batch_key="batch")
sc.tl.pca(adata, n_comps=30, use_highly_variable=True)
We subset to the highly variable genes so that each method has the same input.
adata = adata[:, adata.var.highly_variable].copy()
adata.obsm["Unintegrated"] = adata.obsm["X_pca"]
Run methods#
Here we run a few embedding-based methods. By focusing on embedding-based methods, we can substantially reduce the runtime of the benchmarking metrics.
In principle, graph-based integration methods can also be benchmarked on some of the metrics that have graph inputs. Future work can explore using graph convolutional networks to embed the graph and then using the embedding-based metrics.
Scanorama#
import scanorama

# List of adata per batch
batch_cats = adata.obs.batch.cat.categories
adata_list = [adata[adata.obs.batch == b].copy() for b in batch_cats]
scanorama.integrate_scanpy(adata_list)

adata.obsm["Scanorama"] = np.zeros((adata.shape[0], adata_list[0].obsm["X_scanorama"].shape[1]))
for i, b in enumerate(batch_cats):
    adata.obsm["Scanorama"][adata.obs.batch == b] = adata_list[i].obsm["X_scanorama"]
Liger#
import pyliger

bdata = adata.copy()
# Pyliger normalizes by library size with a size factor of 1
# So here we give it the count data
bdata.X = bdata.layers["counts"]
# List of adata per batch
adata_list = [bdata[bdata.obs.batch == b].copy() for b in batch_cats]
for i, ad in enumerate(adata_list):
    ad.uns["sample_name"] = batch_cats[i]
    # Hack to make sure each method uses the same genes
    ad.uns["var_gene_idx"] = np.arange(bdata.n_vars)


liger_data = pyliger.create_liger(adata_list, remove_missing=False, make_sparse=False)
# Hack to make sure each method uses the same genes
liger_data.var_genes = bdata.var_names
pyliger.normalize(liger_data)
pyliger.scale_not_center(liger_data)
pyliger.optimize_ALS(liger_data, k=30)
pyliger.quantile_norm(liger_data)


adata.obsm["LIGER"] = np.zeros((adata.shape[0], liger_data.adata_list[0].obsm["H_norm"].shape[1]))
for i, b in enumerate(batch_cats):
    adata.obsm["LIGER"][adata.obs.batch == b] = liger_data.adata_list[i].obsm["H_norm"]
Harmony#
from harmony import harmonize

adata.obsm["Harmony"] = harmonize(adata.obsm["X_pca"], adata.obs, batch_key="batch")
scVI#
import scvi

scvi.model.SCVI.setup_anndata(adata, layer="counts", batch_key="batch")
vae = scvi.model.SCVI(adata, gene_likelihood="nb", n_layers=2, n_latent=30)
vae.train()
adata.obsm["scVI"] = vae.get_latent_representation()
scANVI#
lvae = scvi.model.SCANVI.from_scvi_model(
    vae,
    adata=adata,
    labels_key="cell_type",
    unlabeled_category="Unknown",
)
lvae.train(max_epochs=20, n_samples_per_label=100)
adata.obsm["scANVI"] = lvae.get_latent_representation()
Perform the benchmark#
bm = Benchmarker(
    adata,
    batch_key="batch",
    label_key="cell_type",
    bio_conservation_metrics=BioConservation(),
    batch_correction_metrics=BatchCorrection(),
    embedding_obsm_keys=["Unintegrated", "Scanorama", "LIGER", "Harmony", "scVI", "scANVI"],
    n_jobs=6,
)
bm.benchmark()
Visualize the results#
bm.plot_results_table()
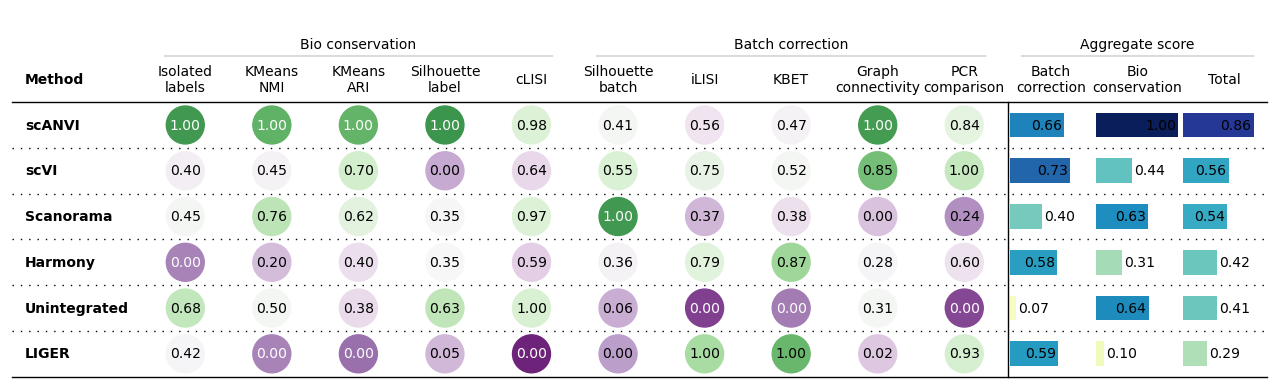
<plottable.table.Table at 0x7f477571fee0>
bm.plot_results_table(min_max_scale=False)
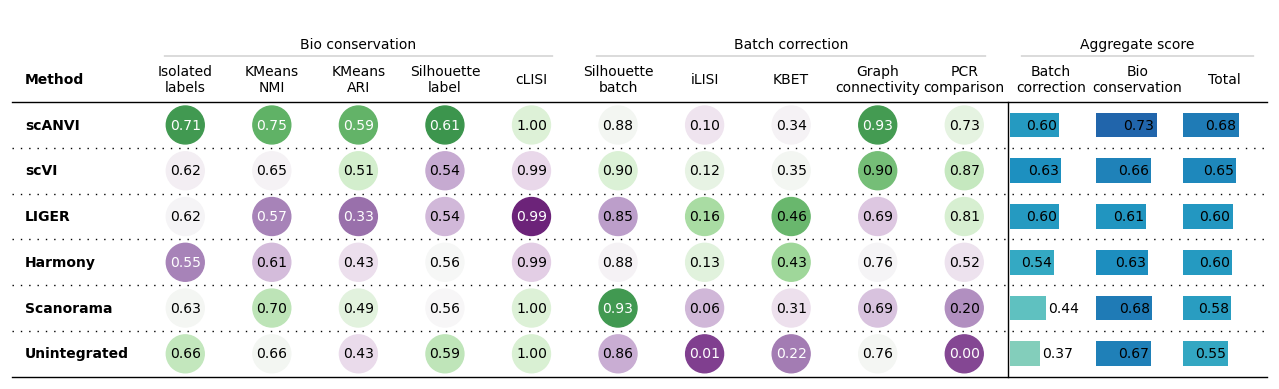
<plottable.table.Table at 0x7f47749a5930>
We can also access the underlying dataframes to print the results ourselves.
from rich import print

df = bm.get_results(min_max_scale=False)
print(df)
               Isolated labels        KMeans NMI        KMeans ARI  \
Embedding
Unintegrated          0.661278          0.659168          0.427279
Scanorama             0.626327          0.704883          0.490931
LIGER                 0.621488          0.570878          0.329819
Harmony               0.554801          0.606546          0.432499
scVI                  0.617493          0.650634          0.509873
scANVI                0.712235          0.747422          0.587875
Metric Type   Bio conservation  Bio conservation  Bio conservation

              Silhouette label             cLISI  Silhouette batch  \
Embedding
Unintegrated          0.585415               1.0          0.855258
Scanorama             0.564498           0.99961          0.932364
LIGER                 0.542106           0.98501          0.850703
Harmony               0.564499          0.993888          0.879939
scVI                  0.538018          0.994553          0.895502
scANVI                0.613172          0.999632          0.884228
Metric Type   Bio conservation  Bio conservation  Batch correction

                         iLISI              KBET Graph connectivity  \
Embedding
Unintegrated          0.008071          0.223882           0.764953
Scanorama              0.06491          0.313843           0.689019
LIGER                  0.16332          0.463284           0.694717
Harmony               0.130195          0.432907           0.756294
scVI                  0.124561          0.347675           0.896865
scANVI                0.095614          0.337137           0.932888
Metric Type   Batch correction  Batch correction   Batch correction

                PCR comparison Batch correction Bio conservation  \
Embedding
Unintegrated                 0         0.370433         0.666628
Scanorama             0.204786         0.440984          0.67725
LIGER                 0.810099         0.596425          0.60986
Harmony               0.521998         0.544267         0.630447
scVI                  0.871396           0.6272         0.662114
scANVI                0.734378         0.596849         0.732067
Metric Type   Batch correction  Aggregate score  Aggregate score

                        Total
Embedding
Unintegrated          0.54815
Scanorama            0.582743
LIGER                0.604486
Harmony              0.595975
scVI                 0.648148
scANVI                0.67798
Metric Type   Aggregate score
df.transpose()
| Embedding | Unintegrated | Scanorama | LIGER | Harmony | scVI | scANVI | Metric Type |
|---|---|---|---|---|---|---|---|
| Isolated labels | 0.661278 | 0.626327 | 0.621488 | 0.554801 | 0.617493 | 0.712235 | Bio conservation |
| KMeans NMI | 0.659168 | 0.704883 | 0.570878 | 0.606546 | 0.650634 | 0.747422 | Bio conservation |
| KMeans ARI | 0.427279 | 0.490931 | 0.329819 | 0.432499 | 0.509873 | 0.587875 | Bio conservation |
| Silhouette label | 0.585415 | 0.564498 | 0.542106 | 0.564499 | 0.538018 | 0.613172 | Bio conservation |
| cLISI | 1.0 | 0.99961 | 0.98501 | 0.993888 | 0.994553 | 0.999632 | Bio conservation |
| Silhouette batch | 0.855258 | 0.932364 | 0.850703 | 0.879939 | 0.895502 | 0.884228 | Batch correction |
| iLISI | 0.008071 | 0.06491 | 0.16332 | 0.130195 | 0.124561 | 0.095614 | Batch correction |
| KBET | 0.223882 | 0.313843 | 0.463284 | 0.432907 | 0.347675 | 0.337137 | Batch correction |
| Graph connectivity | 0.764953 | 0.689019 | 0.694717 | 0.756294 | 0.896865 | 0.932888 | Batch correction |
| PCR comparison | 0 | 0.204786 | 0.810099 | 0.521998 | 0.871396 | 0.734378 | Batch correction |
| Batch correction | 0.370433 | 0.440984 | 0.596425 | 0.544267 | 0.6272 | 0.596849 | Aggregate score |
| Bio conservation | 0.666628 | 0.67725 | 0.60986 | 0.630447 | 0.662114 | 0.732067 | Aggregate score |
| Total | 0.54815 | 0.582743 | 0.604486 | 0.595975 | 0.648148 | 0.67798 | Aggregate score |